
|
What is the Deficit as Percent of Federal Spending?
Deficit: The amount by which the government’s total budget outlays exceeds its total receipts for a fiscal year. —US Senate Budget Committee
In FY 2023 the federal deficit was 27.6 percent of federal spending.
This year, FY 2024, the federal government in its latest budget has estimated that the deficit will be 26.8 percent of federal spending.
| Tweet | | Contact | Follow @chrischantrill |

Federal Deficit Analysis
Recent US Federal Deficits as Percent of Federal Spending

Chart D.41f: Recent US Federal Deficits
as Pct Spending
Federal Deficits exploded in the Great Recession of 2006-08 from 5.9 percent of federal spending in 2007 to nearly 40.2 percent of federal spending in FY 2009, driven mainly by bank bailouts under the TARP program.
After the Crash of 2008 the federal deficits started decreasing, getting below 20 percent of federal spending in FY 2013 and below 12 percent of federal spending in FY 2015, but then increasing again
In 2023 the federal deficit was 27.6 percent of federal spending.
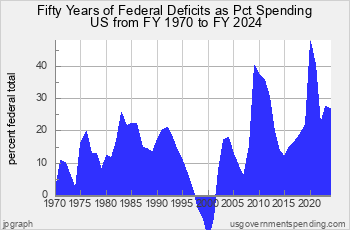
Half a Century of US Federal Deficits as Percent of Federal Spending
Spending Analyses:
Debt, Deficit Analyses:
Numbers — Charts:
US Federal Deficits in the 20th Century

Chart D.43f: Federal Deficits since 1900
The two major peaks of the federal deficit in the 20th century occurred during World War I and World War II when the federal deficit peaked at 70 percent of federal spending. In the Great Depression and its aftermath the federal government ran deficits of about 40 percent of federal spending. But up until the Great Depression the federal government typically ran a large surplus during peacetime.
After World War II federal governments started routinely running deficits in peacetime. Deficits increased steadily from the 1950s through the early 1980s, hitting 20 percent of spending in the 1980s through the 1990-91 recession, and then declined rapidly for the remainder of the 1990s, actually hitting a surplus of about 10 percent of federal spending in 2000.
Federal deficits increased in the early 2000s, and went over 40 percent of federal spending in the aftermath of the financial crisis of 2008.
In the recovery from the Crash of 2008 deficits slowly reduced to about 10 percent of federal spending before increasing to 20 percent of federal spending at the end of the 2010s. In the COVID crisis of 2020 federal spending exceeded 40 percent of federal spending.

Suggested Video: What is the Deficit?
Top Debt Requests:
Find DEFICIT stats and history.
US BUDGET overview and pie chart.
Find NATIONAL DEBT today.
See FEDERAL BUDGET breakdown and estimated vs. actual.
Check STATE debt: CA NY TX FL and compare.
See DEBT ANALYSIS briefing.
See DEBT HISTORY briefing.
Take a COURSE at Spending 101.
Make your own CUSTOM CHART.
Debt Data Sources
Debt data is from official government sources.
- Federal debt data since 1962 comes from the president’s budget.
- Federal debt for 1940-1961 comes from the president’s budget.
- Federal debt for 1914-1939 comes from the
US Treasury
and St. Louis Fed.
- Federal debt before 1914 comes from the
US Treasury
- All other debt data comes from the US Census Bureau.
Gross Domestic Product data comes from US Bureau of Economic Analysis and measuringworth.com.
Detailed table of debt data sources here.
Federal debt data begins in 1792.
State and local debt data begins in 1820.
State and local debt data for individual states begins in 1957.

Gross Federal Debt
| Debt Now: | $34,616,994,016,250.88 | Debt 2/2020: | $23,409,959,150,243.63 |
Site Search
Spending 101
Take a course in government spending:
Spending |
Federal Debt |
Revenue
Defense |
Welfare |
Healthcare |
Education
Debt History |
Entitlements |
Deficits
State Spending |
State Taxes |
State Debt
It’s free!
Win Cash for Bugs
File a valid bug report and get a $5 Amazon Gift Certificate.
Get the Books
 Price: $0.99 Or download for free. |
 From usgovernment spending.com Price: $1.99 |
 Life after liberalism Price: $0.99 Or download for free. |
Data Sources for 2019_2029:
Sources for 2019:
GDP, GO: GDP, GO Sources
Federal: Fed. Budget: Hist. Tables 3.2, 5.1, 7.1
State and Local: State and Local Gov. Finances
'Guesstimated' by projecting the latest change in reported spending forward to future years
Sources for 2029:
GDP, GO: GDP, GO Sources
Federal: Fed. Budget: Hist. Tables 3.2, 5.1, 7.1
State and Local: State and Local Gov. Finances
'Guesstimated' by projecting the latest change in reported spending forward to future years
> data sources for other years
> data update schedule.
Blog
Federal Budget for FY25 Released
On March 11, 2024, we updated usgovernmentspending.com with the numbers from the Public Budget Database in the Budget of the United States Government for Fiscal Year 2025.
Here is how headline budget estimates for the upcoming FY 2024 fiscal year have changed since the release of the FY 2024 budget a year ago in Winter 2023.
| $ billion | Estimate for 2024 in FY2024 Budget | Estimate for 2024 in FY2025 Budget | Change |
| Federal Outlays | $6,371.8 | $6,940.9 | +$569.1 |
| Federal Receipts | $4,802.5 | $5,081.6 | +$279.1 |
| Federal Deficit | $1,569.4 | $1,859.4 | +$290.0 |
You can see line item changes from budget to budget here. You can compare budget estimates with actuals here.
Account level spending estimates through FY 2029 come from the Outlays table in the Public Budget Database and were updated on usgovernmentspending.com on March 11, 2024.
Account level budget authority estimates through FY 2029 come from the Budget Authority table in the Public Budget Database and were updated on usgovernmentspending.com on March 11, 2024.
On March 11, 2024, usgovernmentspending.com updated its data for agency debt from the Federal Reserve Board database. Data is now available for the period 1945-2023. You can see our Agency Debt pag ...
On January 19, 2024 usgovernmentspending.com updated its GDP series with the latest data from the Bureau of Economic Analysis, ...
> blog
Budget News
President’s FY 2025 Budget Release Scheduled for March 11
Although the FY 2024 appropriations process is not yet resolved
Biden to Release Budget March 9
will press McCarthy On Default Risk - Bloomberg
Biden to Release 2023 Budget Request on March 28
how the administration expects to spend money for priorities including aid to Ukraine and the continuing effort to fight the coronavirus pandemic, as well as legislative proposals such as increased funding for community policing programs, cancer research, and mental health education.
> archive
Spend Links
us numbers • us budget • custom chart • deficit/gdp • spend/gdp • debt/gdp • us gdp • us real gdp • state gdp • breakdown • federal • state • local • 2022 • 2023 • 2024 • california • texas
